Service Lens as Next gen monitoring for Serverless & Container-based applications

Amazon CloudWatch Service Lens is fully managed observability solution to help with visualizing and analysing the health, performance, and availability of highly distributed applications, including those with dependencies on serverless and container-based technologies.

Services are becoming more and more digitalized today, i.e. mobile online / web or both. Any service disruption can lead to near permanent loss of customers who experience the same, especially in B2C business. Not all business can afford 100% uptime especially those that are part of start-up idea.

Given the modern component based architectures and technology stacks ensures there are different components interact with each other to ensure ultimate user experience. From Mobile app, CDNs, API gateways, authentication layers, application layers, cache layers and database layers to name a few. Each of them having their own infrastructure, network & scaling mechanism.  With all best monitoring of their individual availability and tracking metric of their performance to ensure they are their peaks still there are times when the services are disrupted.

Moore’s Law always catches up even if you have designed for best of availability.  In such scenarios it is crucial, to have a quick way to troubleshoot the issues that impacts customer experience. In order to do that you need not just individual component level minute by minute monitoring or metrics but a traceable, trackable, coherent comprehensive end to end, Real Time Monitoring dashboard that quickly helps to narrow down the point of concern that has impacted the services.

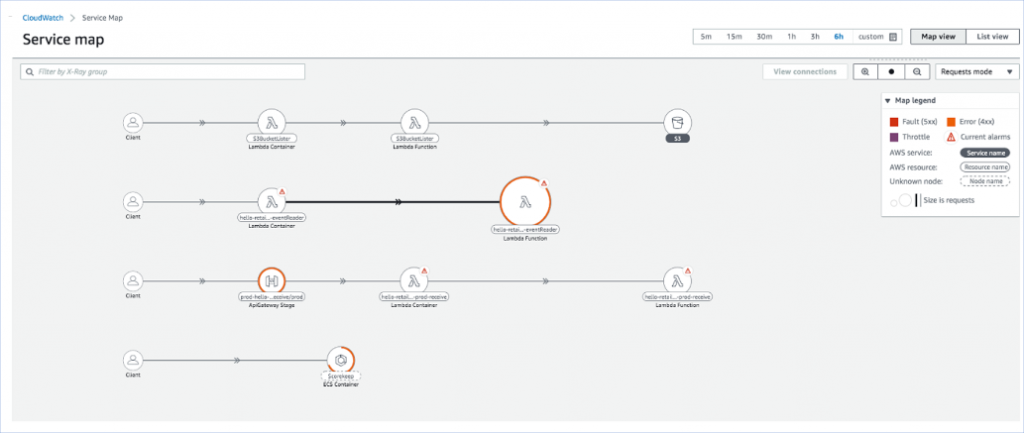
As a cloud service provider, Amazon provides Amazon CloudWatch, an integrated tool for real-time monitoring and metrics tracking for each service including for the serverless services and extendable through custom metrics. Now they add an extra layer of real-time monitoring tool called “Service Lens”.

What is Service lens?

Amazon CloudWatch Service Lens is fully managed observability solution to help with visualizing and analysing the health, performance, and availability of highly distributed applications, including those with dependencies on serverless and container-based technologies.

Service Lens looks to improve visibility into the AWS applications in three specific areas:

  • The first is infrastructure monitoring by leveraging metrics and logs to troubleshoot the resources supporting the application.
  • The second is transaction monitoring by using traces to investigate the dependencies between resources.
  • The Third is End user monitoring by using synthetics, monitor application endpoints 24/7 accessing the impact to the end-customer experience and alerting you in case of any failures.

By enabling the service lens, to easily isolate the resources that are experiencing issues, together with analysis of correlated metrics, logs, and application traces, CloudWatch Service Lens helps reduce Mean Time to Resolution (MTTR) by consolidating all of this data in a single place using a service map. By this service map clearly tells the relationships and dependencies within your applications, and dive deep into the various logs, metrics, and traces from a single tool to help you quickly isolate faults.

Service Lens Overview

Service Lens integrates CloudWatch with AWS X-Ray to provide an end-to-end view of your application to help you more efficiently pinpoint performance bottlenecks and identify impacted users.

A service map displays your service resources as “nodes” and highlights the traffic, latency, and errors for each node and its connections.

  • The traffic of a service is represented by the size of that service on the Service Map. The bigger the size, the more traffic that service gets.
  • Faults and errors are represented directly on the map and gain additional insights on errors and faults by clicking on a service or application on the map and accessing its expanded view.
  • Alarms also displayed in the same.

The Service Map consists of Nodes (circles) indicating the individual components that are part of the application and Edges (lines connecting the circles) that shows the traffic between the Nodes. Two types of modes available in the service Map.

Request Mode: the size of the Nodes indicates the number of requests the application component is receiving and sending. The thickness of the Edges indicates the amount of traffic flowing between two Nodes.

Latency Mode: The Service Map’s Node size and the Edge thickness now automatically adjust to indicate Latency.

CloudWatch Service Lens, Synthetics and Contributor Insights are recent addons that expand the scope of AWS application monitoring. NOC team that want to set up advanced application monitoring can implement these CloudWatch features for early detection and fast remediation of application issues in AWS. Explore how these features build on current monitoring capabilities and learn how to get started with these AWS monitoring features.

Centralized AWS application monitoring

Service Lens organizes AWS X-Ray traces and data from CloudWatch Metrics, Alarms and Logs. so, the information can be visualized in a single place. In order to understand Service Lens, NOC team must be familiar with AWS X-Ray, which collects data for requests handled by applications. it includes which systems initiate them, their targets, any latencies and status codes etc.

To activate Service Lens, first enable the X-Ray agent in compute infrastructure i.e. EC2 instances, Fargate containers or Lambda functions. Before, X-Ray traces were only available in isolated way and it was very difficult to identify the behaviour in X-Ray with other system data, such as CloudWatch metrics or logs. “Now organizing all this data in a single place, Service Lens delivers a clear context to admins and allows for better monitoring and troubleshooting of their applications in AWS more effectively”.

Pricing –  Service Lens itself is free, users pay only for X-Ray usage as well as any use of CloudWatch Metrics and CloudWatch Logs. X-Ray charges $5 per million traces recorded, $0.50 per million traces scanned and $0.50 per million traces retrieved.

Synthetics tests from user Perspective:

With CloudWatch Synthetics, developers can configure canaries that trigger and monitor common user interactions on web applications. For ex, developers can configure requests to application APIs at a configurable frequency. These canaries evaluate the data and status codes returned by the APIs and also trigger CloudWatch alarms according to the response.

With these canaries, Synthetics brings a user experience perspective to AWS application monitoring in CloudWatch. Before, CloudWatch users could only focus on system metrics, traces and logs. While these are essential troubleshooting pieces, they don’t detect specific issues from an end-user and business perspective.

Pricing: As part of the AWS Free Tier you get 100 canary runs per month at no charge. After that, you pay per run, with prices starting at $0.0012 per run, plus the usual charges for S3 storage and Lambda invocations.

Insights of Service Lens and Service Map:

  1. Service Lens digs deep analysis into the services and applications of the AWS cloud environment
  2. Service Map that visualizes the contextual linking of all your resources, along with an intuitive interface so you can dive deep into correlated monitoring data.


Once services are Configured, we can define parameters for alarms. When an alarm is triggered, we can dig deep into the visual map in Request mode or Latency mode. Also, the Identifying specific bottlenecks and troubleshooting errors is easy with these tools at your fingertips. Even we have visualization of all service metrics displayed, including latency, requests, faults, and drilldowns such as throttles and invocations.

User Monitoring Journey:

Observe: Overview and identify of all resources and their health in the single Channel.

Inspect: Know when your end user experience has degraded.

Isolate: Identify performance bottlenecks and issues.

Diagnose: Dive deep into node level insights using Dashboards.

CloudWatch Service Lens is a powerful monitoring tool that you cannot afford to miss. Combined with Synthetics, you can always leverage real-time monitoring to maintain user experience.

Reach out to us if you need more details!


Written by :     Mahavishnu  & Umashankar N

Sharing is caring!

Subscribe to our Newsletter1CloudHub