In today’s data-driven world, the efficiency of key business decisions hinges on the quality of available data. The ability to interpret and derive meaningful insights from data is crucial. Business Intelligence (BI) tools play a vital role in enhancing data quality by adding a presentation layer, transforming raw data into actionable information that drives effective decision-making.
The BI tools market is highly competitive, featuring numerous players such as Tableau, Microsoft Power BI, QlikView, SAS, IBM Cognos, and Google Data Studio, each offering unique functionalities and features.
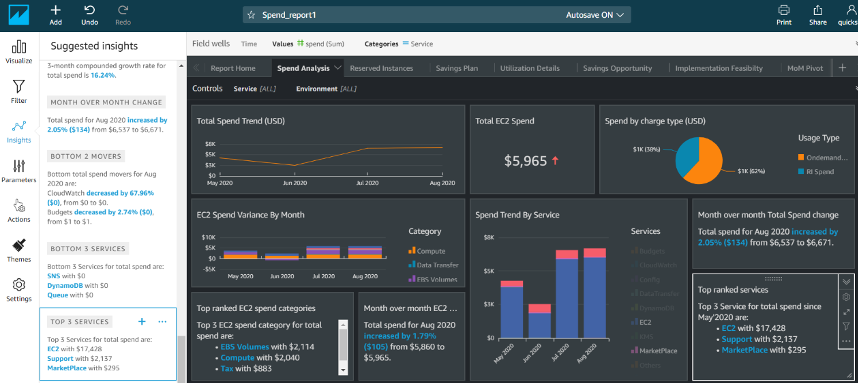
In this blog, we’ll delve into the distinctive features of AWS’s relatively new BI tool, QuickSight, and explore why it is gaining traction amidst a crowded field of BI solutions.
Amazon QuickSight
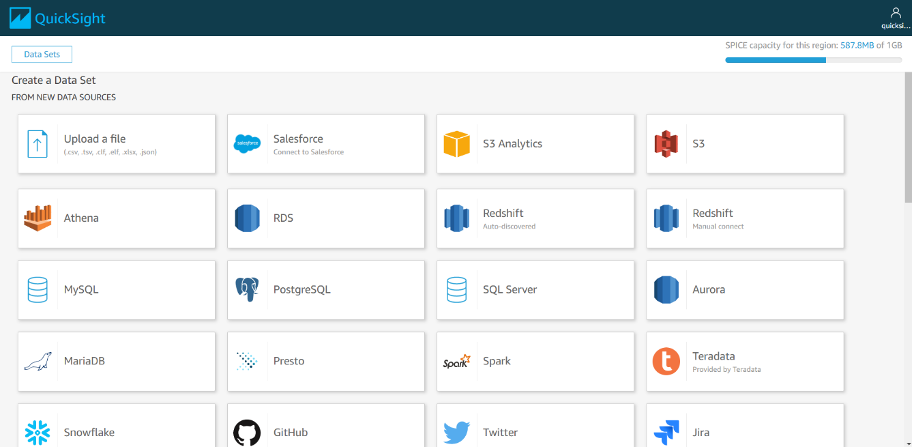
Amazon QuickSight empowers data-driven organizations by providing unified business intelligence (BI) at hyperscale. With QuickSight, all users can address diverse analytical needs from a single source of truth through modern interactive dashboards, paginated reports, natural language queries, and embedded analytics.
Key Features of Amazon QuickSight
Cost-Effective and Fast: Amazon QuickSight powers millions of dashboard views efficiently, providing a high-performance, interactive experience at a lower cost.
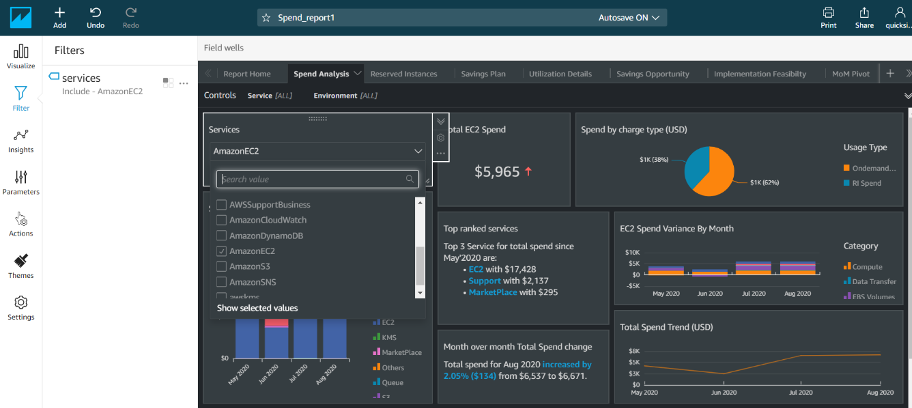
Interactive Data Discovery: Users can uncover hidden data and mine insights within an engaging visual environment, making analysis more intuitive and insightful.
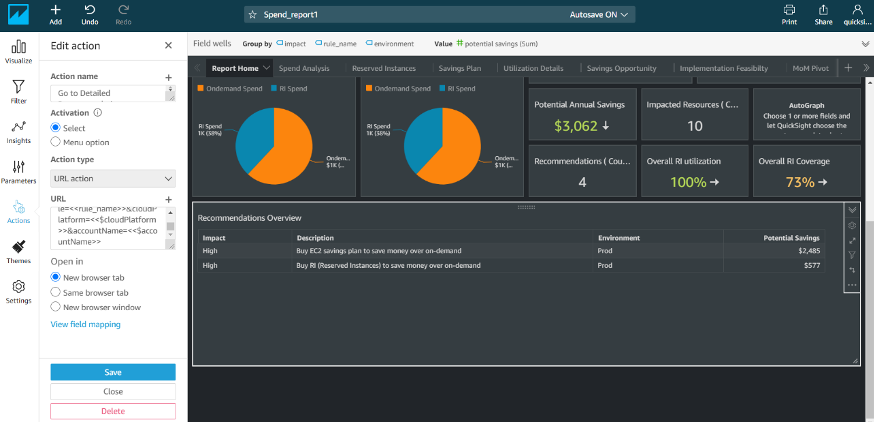
Accurate Forecasting and What-If Analysis: QuickSight offers precise forecasting capabilities and robust what-if analysis to support strategic decision-making.
Effortless Visualizations: Empowering users with advanced visualizations without the need for time-consuming data preparation, freeing authors and admins to focus on more critical tasks.
Seamless Embedding: Easily embed interactive visualizations and dashboards into applications and websites, enhancing accessibility and user engagement.
Natural Language Query: Utilize natural language query capabilities within dashboards and applications, making it easier for users to gain insights without extensive technical knowledge.
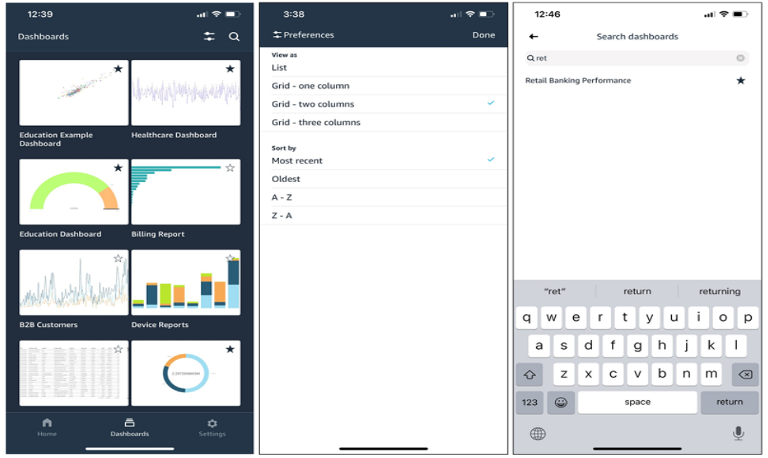
Universal Access: Access QuickSight from any device—laptop, desktop, smartphone, or tablet. Even when offline, the offline mode ensures uninterrupted data analysis and visualization.